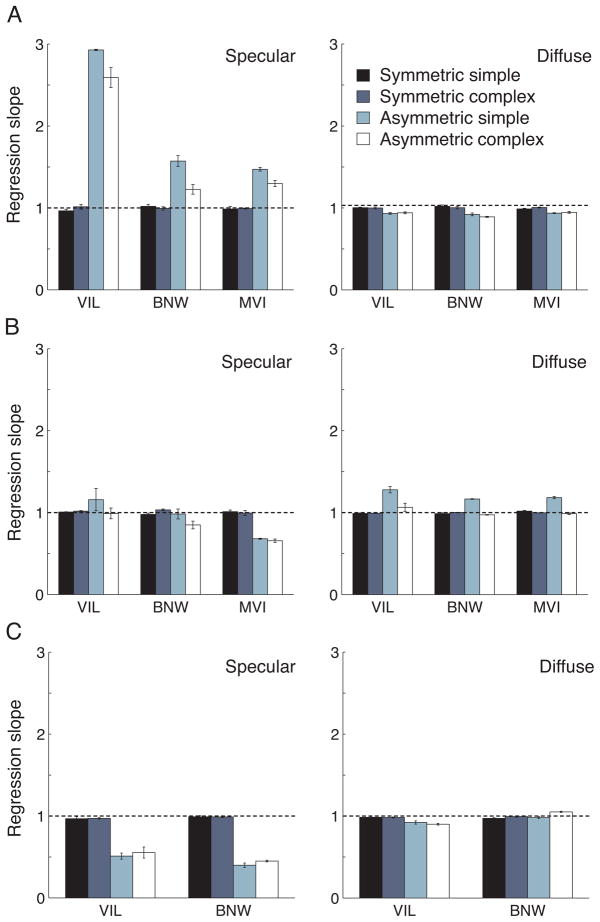
Figure 5.
A) Regression slopes for the kitchen/beach comparison. The left panel shows the slopes for the specular component matches; the right panel shows the slopes for the diffuse component matches. The three sets of bars in each panel are for the three observers. The bars in each group are from left to right: simple symmetric, complex symmetric, simple asymmetric, complex asymmetric. Slopes plotted were obtained by fitting the data for each of the three replications separately and taking the mean; error bars show the standard error of this mean. The horizontal black lines indicate veridical matches. B) and C) show the slopes for the kitchen/campus comparison and for the kitchen/galileo comparison, respectively. In C), data for two observers are shown. Otherwise, details are as in A).

