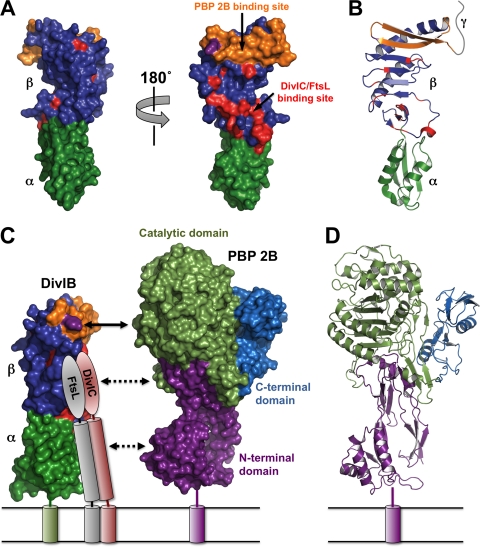
FIG. 5.
(A) Surface representation of the crystal structure of E. coli FtsQ (Protein Data Bank [PDB] file 2VH1). The views on the left and right are related by a 180° rotation around the long axis of the molecule. The α and β domains are shown in dark green and blue, respectively. Residues previously demonstrated to be involved in the interaction of S. pneumoniae DivIB with the FtsL-DivIC heterodimer (25) are highlighted in red while the region shown in the current study to be critical for the interaction with PBP 2B (i.e., residues 229 to 257) is shown in orange. Note that these protein-protein interaction epitopes are mutually exclusive. The Y246 residue that leads to cell death at elevated growth temperatures when mutated to Ala is highlighted in magenta. (B) Ribbon representation of E. coli FtsQ highlighting the secondary structure of the regions involved in interaction with PBP 2B, FtsL, and DivIC. The color scheme and molecular orientation are the same as those of the molecule shown on the right in panel A. The highly variable γ tail is represented schematically as a gray ribbon. (C) Model of the DivIB/PBP 2B/FtsL/DivIC complex. The cytoplasmic domains and the γ tail of DivIB are omitted for the sake of clarity. The color scheme for DivIB is the same as in panels A and B. The C-terminal region and coiled-coil region of FtsL and DivIC are represented as ovals and cylinders, respectively. The C-terminal “heads” of the FtsL-DivIC heterodimer are shown interacting with residues in the β domain (red) that were defined by NMR chemical shift mapping (25). Shown to scale on the right is a surface representation of S. pneumoniae PBP2x. The region of DivIB demonstrated in the current study to be critical for interaction with PBP 2B (orange) aligns with the catalytic domain of PBP 2B (light green). The model suggests that the head and coiled-coil regions of the FtsL-DivIC heterodimer might interact with the transpeptidase and N-terminal domains of PBP 2B, respectively; these putative interactions are represented by the dotted lines. (D) Ribbon representation of the crystal structure of S. pneumoniae PBP2x with the N-terminal domain, catalytic domain, and C-terminal domain highlighted in magenta, light green, and cyan, respectively.

