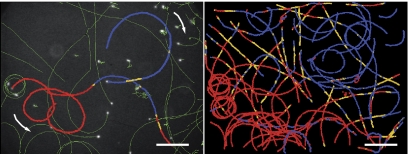
FIG. 1.
(Left) Image of the trajectories (green) of E. coli (4-h growth time) swimming in the air-TN interfaces superimposed on the last frame of one acquisition (bacteria in white). Motion orientation of three highlighted trajectories is indicated by arrows, and values of instantaneous curvature (κi) are color coded. (Right) κi image of the trajectories of three consecutive acquisitions. CCW, red (κi <−0.007 μm−1); linear, yellow (−0.007 μm−1 < κi < 0.007 μm−1); CW, blue (0.007 μm−1 < κi). Bar, 35 μm.

