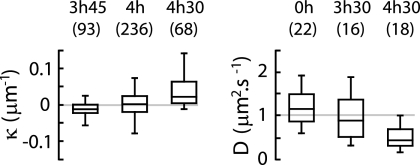
FIG. 3.
Box plots showing κ of the trajectories of E. coli swimming (growth time specified) (left) and D of polystyrene beads in three air-TN interfaces (298 by 224 μm2) (right). Center lines show medians, and edges show the first and third quartiles. “Whiskers” extend to the largest and smallest data points within 1.5 interquartile ranges of the first and third quartiles. Numbers of trajectories are in parentheses.

