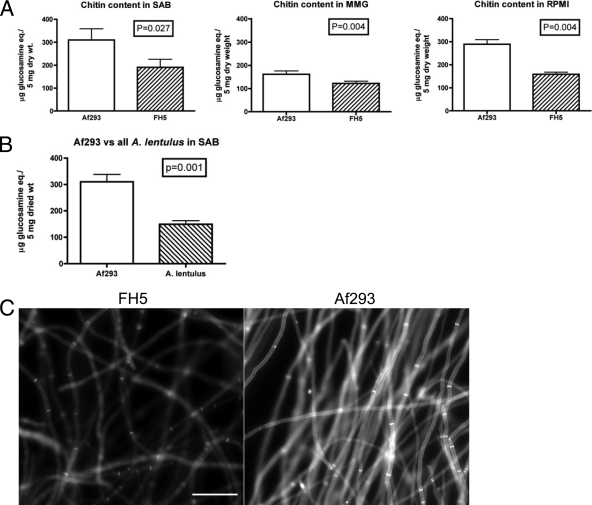
FIG. 3.
Decreased amounts of chitin in A. lentulus relative to A. fumigatus. (A) Comparison of the total chitin content in A. lentulus (FH5) and A. fumigatus (Af293) grown at 37°C for 48 h in three different media. The values are means of independent biological replicates sampled in duplicate (n = 4). (B) Comparison of five A. lentulus isolates (FH1, FH5, FH6, FH86, and FH239) to A. fumigatus (Af293) grown in SAB. The A. lentulus value is the mean from two independent samples of each isolate (n = 10). The A. fumigatus value is the mean from six independent samples (n = 6). Error bars represent ± standard deviations. Significance was determined by the two-tailed Student's t test assuming unequal variance. (C) Calcofluor white staining of A. fumigatus and A. lentulus hyphal elements to visualize relative chitin levels. Fifteen-hour SAB cultures of A. fumigatus (Af293) and A. lentulus (FH5) grown on coverslips were stained for calcofluor white and observed under UV light. The images were captured at a set exposure time (700 ms) to reflect the difference in calcofluor white staining between the organisms. Size bar, 50 μm.

