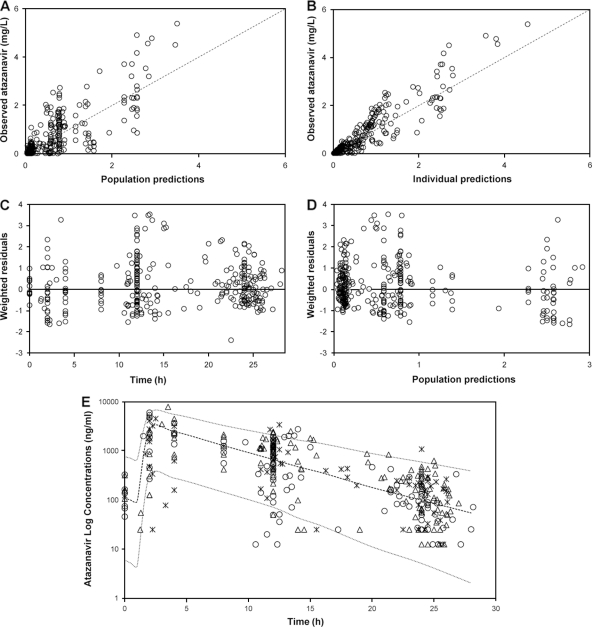
FIG. 1.
(A and B) Goodness-of-fit plots for the final pharmacokinetic model illustrating population predictions of atazanavir versus observed concentrations (A) and individual predictions of atazanavir versus observed concentrations (B); the broken line describes the line of unity. (C) Weighted residuals versus time postdose. (D) Population predictions of atazanavir versus weighted residuals; the thin black line is at ordinate value zero. (E) Ninety-five percent prediction intervals (P2.5 to P97.5) determined from simulated data of unboosted atazanavir administered at 400 mg once daily. Atazanavir plasma concentrations (n = 323) in 182 infected patients are superimposed, asterisks represent concentrations in individuals carrying wild-type alleles (41 patients), open circles represent concentrations in individuals carrying heterozygous alleles (85 patients), and open triangles represent concentrations in individuals carrying homozygous mutant alleles (56 patients).

