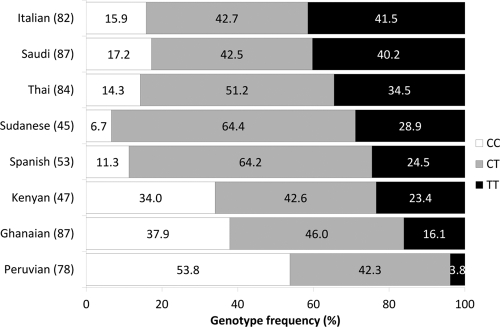
FIG. 4.
Genotype frequencies of PXR 63396C→T in eight ethnic groups. Vertical bars represent genotype frequencies of the different populations arranged from those with the highest frequency to those with the lowest frequency of the T allele. Percent frequencies of genotypes are shown in white for CC, gray for CT, and black for TT. The number of patients included for each population is given in parentheses next to the ethnicity.

