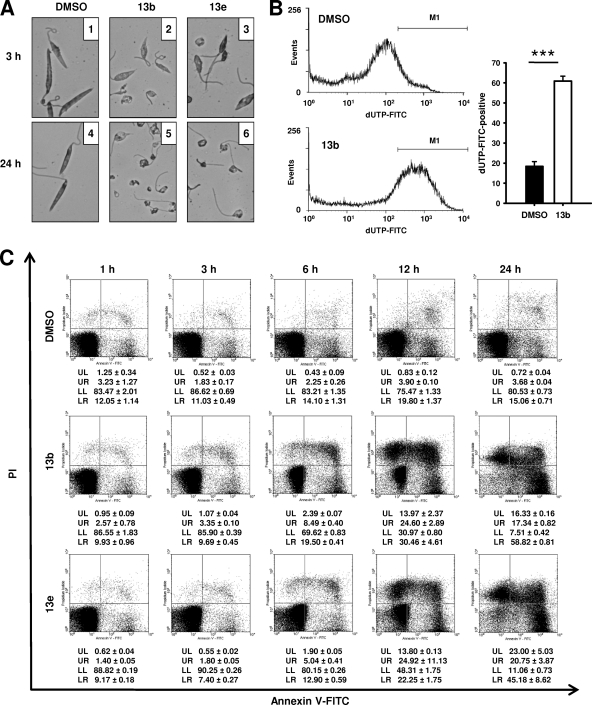
FIG. 3.
Analysis of cell morphology and results of TUNEL assay and annexin V/PI staining. L. major promastigotes were incubated with 100 μM compound 13b or 13e. Control cultures were supplemented with DMSO-containing RPMI medium. (A) Alterations of cell morphology were investigated by Giemsa staining. (B) DNA fragmentation was investigated by TUNEL staining in promastigotes treated with compound 13b. The percentage of dUTP-FITC-positive promastigotes was determined by flow cytometric analysis. The values represent means ± SEMs for three samples. Histograms of representative samples are shown. Marker 1 (M1) indicates the region of dUTP-FITC-positive events. ***, P ≤ 0.001. (C) Annexin V-FITC/PI staining was performed after 1 to 24 h. Dot plots of representative samples and results of quadrant statistics are shown. The values represent means ± SEMs for three samples. UL, upper left quadrant; UR, upper right quadrant; LL, lower left quadrant; LR, lower right quadrant.

