FIG. 4.
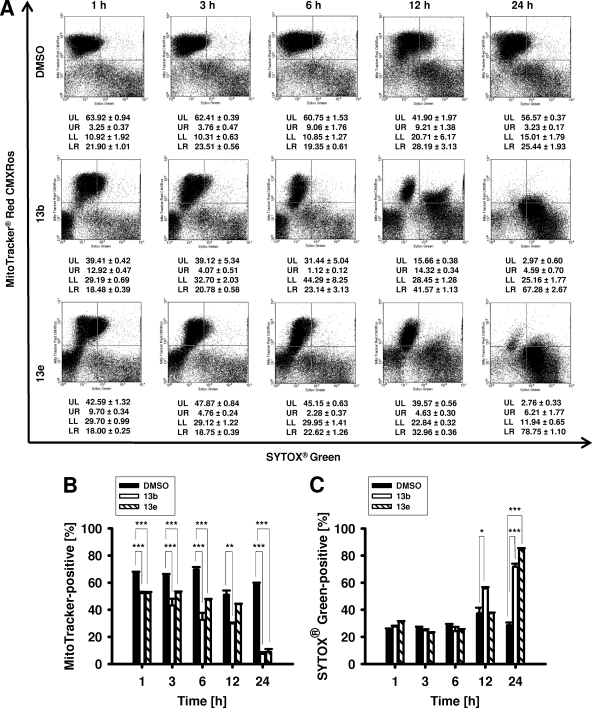
Analysis of mitochondrial transmembrane potential and plasma membrane integrity. L. major promastigotes were incubated with 100 μM compound 13b or 13e. Control cultures were supplemented with DMSO-containing medium. (A) Parasites were harvested at several time points of incubation (1 to 24 h) and double stained with MitoTracker red CMXRos to monitor the changes in mitochondrial transmembrane potential and with the DNA-binding dye SYTOX green to investigate plasma membrane integrity by flow cytometry. Dot plots of representative samples and results of quadrant statistics are shown. (B and C) Results of single-parameter analyses of MitoTracker red CMXRos-positive (B) and SYTOX green-positive (C) promastigotes. Values represent means ± SEMs for three samples. UL, upper left quadrant; UR, upper right quadrant; LL, lower left quadrant; LR, lower right quadrant; *, P ≤ 0.05; **, P ≤ 0.01; ***, P ≤ 0.001.

