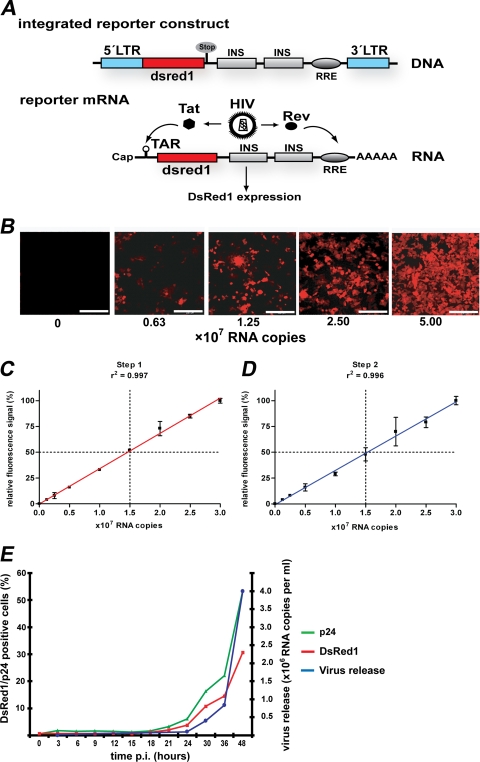
FIG. 1.
Monitoring HIV infection with the HIV reporter cell line LC5-RIC. (A) Tat- and Rev-dependent HIV reporter gene in LC5-RIC cells. The integrated reporter gene contains a 5′ HIV LTR (blue) for Tat-inducible transcription, sequences encoding the red fluorescent DsRed1 reporter protein (red), and HIV-1 derived sequences for Rev-dependent expression (gray). The last consist of inhibitory sequences (INS) from the HIV-1 gag gene (p17/p24 region) and the Rev-response element (RRE) from the HIV-1 env gene (57). HIV infection of cells causes production of Tat and Rev, which is initiated in the early phase of HIV replication. Binding of Tat and Rev to reporter mRNAs at the trans-activating response region (TAR) and RRE, respectively, induces expression of the DsRed1 reporter protein. (B) HIV-dependent appearance of red-fluorescent cells in LC5-RIC cultures. LC5-RIC cultures in six-well plates were exposed to various amounts of HIV (viral RNA copy numbers indicated), and cultures were inspected by fluorescence microscopy 48 h after virus addition. Bar, 200 μm. (C) Linear correlation between the fluorescent signal intensities of infected LC5-RIC cultures and the amounts of virus (i.e., viral RNA copy numbers) used for infection (i.e., primary infection). Fluorescent signal intensities were measured at 48 h after virus addition by microplate fluorimetry. Values were normalized to the value obtained with the largest amount of virus (set at 100%). Each data point represents the mean value of six wells ± standard deviations. (D) Quantification of infectious virus titers released by LC5-RIC cultures. Aliquots of supernatants of the infected primary cultures from panel C were transferred to secondary LC5-RIC cultures, and fluorescent signal intensities of secondary cultures were measured 72 h after transfer. Values were normalized to the value obtained with the highest viral load (set at 100%). Each data point represents the mean value ± standard deviations. (E) Temporal correlation of red fluorescent signal intensities and virus production by LC5-RIC cultures in six-well plates exposed to a viral load of 5 × 10⁷ viral RNA copies. The proportions of cells positive for DsRed1 or HIV Gag-p24 were analyzed at various time points after virus addition (p.i.) by flow cytometry. The amounts of viral RNAs in culture supernatants were determined by standardized quantitative RT-PCR. Each data point represents the mean of three wells.

