
TABLE 3.
Predicted candidate T. pallidum rare outer membrane proteins
| Protein tag | Name | OM localization/β-barrel predictionsa |
Signal sequence predictionsd |
||||||||
|---|---|---|---|---|---|---|---|---|---|---|---|
| Cello | Psort | TMBETADISC (PSSM profileb) | TMBETADISC (AACc) | Bomp | Hhomp | Predtmbb | Ymaxe (SignalP 3.0) | Sf (PrediSI) | Signal-CFg | ||
| Group 1 | |||||||||||
| TP0326 | BamA | + | + | + | + | + | + | + | 0.831 | 1 | + |
| TP0865 | HPh | + | + | + | + | + | + | + | 0.125 | 0.70 | + |
| Group 2 | |||||||||||
| TP0117 | TprC/D | + | − | + | + | + | + | + | 0.531 | 0.65 | + |
| TP0620 | TprI | + | − | + | + | + | + | + | 0.531 | 0.65 | + |
| TP0621 | TprJ | + | + | + | + | − | + | + | 0.691 | 0.72 | + |
| TP0969 | HP | + | + | + | + | − | + | + | 0.205 | 0.37 | + |
| Group 3 | |||||||||||
| TP0316 | TprF | + | − | + | + | − | + | + | 0.518 | 0.65 | + |
| TP1031 | TprL | + | − | + | − | + | + | + | 0.065 | 0 | − |
| Group 4 | |||||||||||
| TP0009 | TprA | + | − | + | + | + | − | − | 0.234 | 0.22 | − |
| TP0011 | TprB | + | − | + | − | − | + | + | 0.324 | 0.477 | + |
| TP0155 | CHPi | + | + | + | + | − | − | − | 0.13 | 0.7 | + |
| TP0313 | TprE | + | − | + | − | − | + | + | 0.691 | 0.72 | + |
| TP0325 | CHP | + | − | − | + | + | + | − | 0.218 | 0.47 | + |
| TP0421 | CHP | + | + | + | − | − | − | + | 0.443 | 0.75 | + |
| TP0548 | HP | + | − | + | − | − | + | + | 0.226 | 0.64 | + |
| TP0729 | HP | + | + | + | + | − | − | − | 0.27 | 0.80 | + |
| TP0855 | HP | + | + | + | + | − | − | − | 0.432 | 0.54 | + |
| TP0858 | HP | + | − | + | − | − | + | + | 0.249 | 1 | + |
| TP0897 | TprK | + | − | + | − | − | + | + | 0.75 | 0 | − |
Proteins are grouped according to the number of programs that predict OM localization or β-barrel formation.
Position-specific scoring matrix profiles.
Amino acid composition.
Predicted N-terminal sequences and cleavage sites are shown in Fig. S1 in the supplemental material.
Ymax is a derivative of the C score combined with the S score, where the C score is the cleavage site score and the S score is the amino acid position score in the signal sequence (10). A Ymax score of >0.4 indicates a cleaved signal sequence.
The score was calculated using the equation 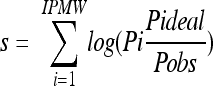 (59). A score of >0.5 indicates a cleaved signal sequence.
Presence (+) or absence (−) of a cleavable signal sequence.
HP, hypothetical protein.
CHP, conserved hypothetical protein.