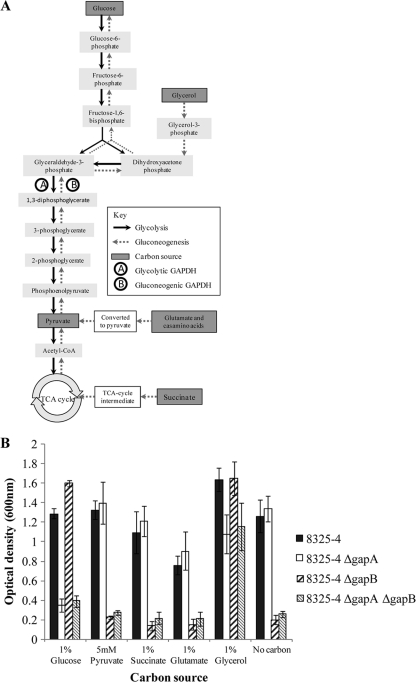
FIG. 3.
(A) Flow chart indicating where the various carbon sources can enter glycolysis and gluconeogenesis during carbon metabolism. (B) Graph showing the level of growth of the 8325-4, 8325-4 ΔgapA, 8325-4 ΔgapB, and 8325-4 ΔgapA ΔgapB strains after a 5-h incubation in TM medium supplemented with an additional carbon source. Cultures were grown at 37°C with aeration, and growth was measured as the optical density of the culture at 600 nm. Each experiment was repeated three times on different days, and the data presented are averages, with error bars indicating the standard deviations. CoA, coenzyme A.

