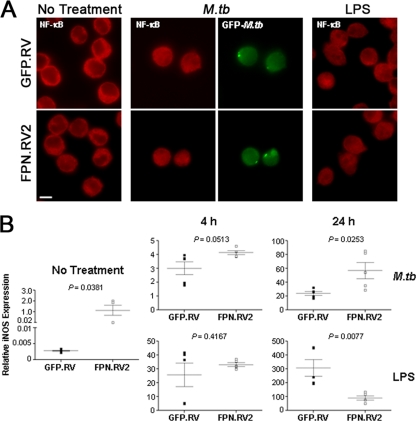
FIG. 4.
iNOS mRNA is induced in ferroportin overexpressing cells. (A) J774-GFP.RV or J774-FPN.RV2 cells were infected with M. tuberculosis or treated with LPS for 4 h. NF-κB activation was determined using nuclear localization with a polyclonal anti-NF-κB antibody. (B) Cells were infected with M. tuberculosis at an MOI of 5 or treated with 1 μg of LPS/ml. Cells were lysed in TRIzol reagent at 0, 4, and 24 h postinfection or treatment. Relative iNOS expression was determined by using qRT-PCR analysis. Gene expression is represented as the 2−ΔCT between iNOS and a reference gene (36B4). For statistical analysis, the means ± the SEM from replicate experiments (n = 5) are shown. Statistical significance was determined by using the Student t test.

