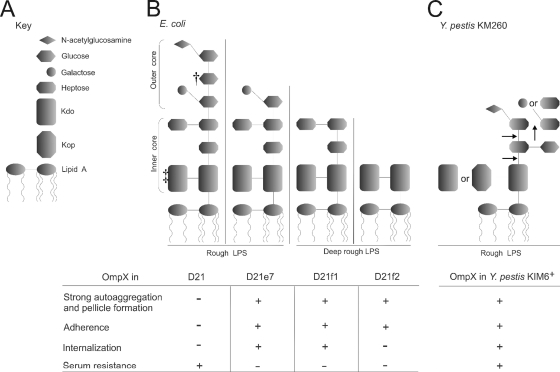
FIG. 6.
Schematic representation of E. coli and Y. pestis LPS structures and summary of the results. (A) Key to LPS moieties. (B) LPS structures of E. coli K-12 D21 and its isogenic mutants (23, 40, 44, 46, 59). †, some sources indicate galactose (23); ‡, some sources indicate two or three KDO residues (40). (C) LPS core structure of Y. pestis KM260 grown at ambient temperature; arrows indicate truncation of the core residues that resulted in loss of serum resistance (24). The table shows presence (+) or lack (−) of OmpX-mediated phenotypes (autoaggregation and pellicle formation, adhesion to Hep-2 cells, internalization into Hep-2 cells, and human serum resistance) related to a particular strain. Data are a summary of this study and previous work on OmpX of Y. pestis KIM6+ (26).

