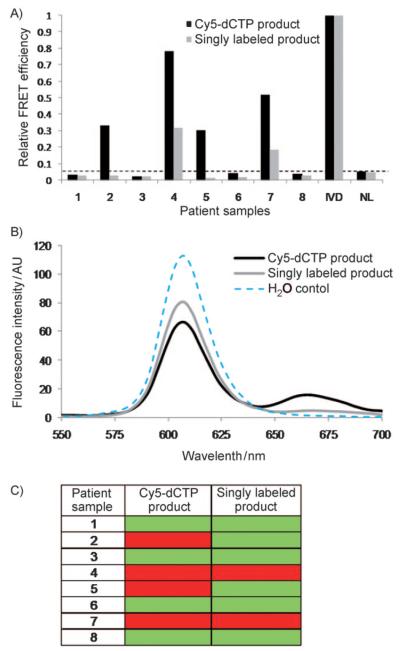
Figure 3.
Analysis of p16INK4a methylation of patient serum. A) Comparison of normalized FRET efficiency for singly ( ) and multiply (■) labeled methylated product. IVD=in vitro-methylated DNA. Values equal or lower than normal lymphocytes (NL) were scored as 0. B) Representative trace demonstrating a marked increase in Cy5 signal at 670 nm for multiply labeled product when compared to singly labeled product. C) Results summary of PCR. Green boxes represent unmethylated product and red boxes represent methylated product.

