Figure 6.


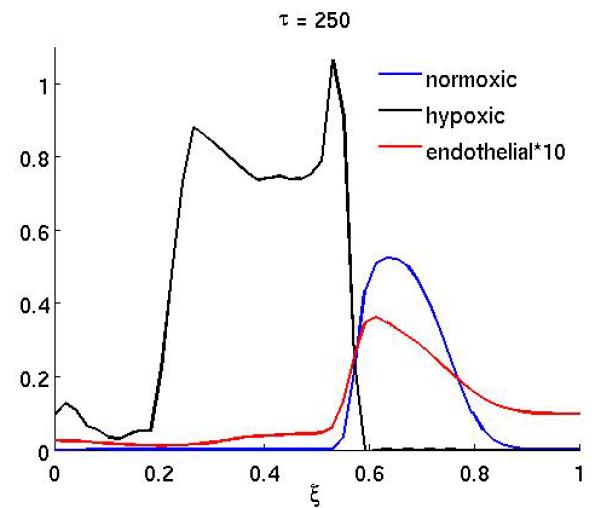
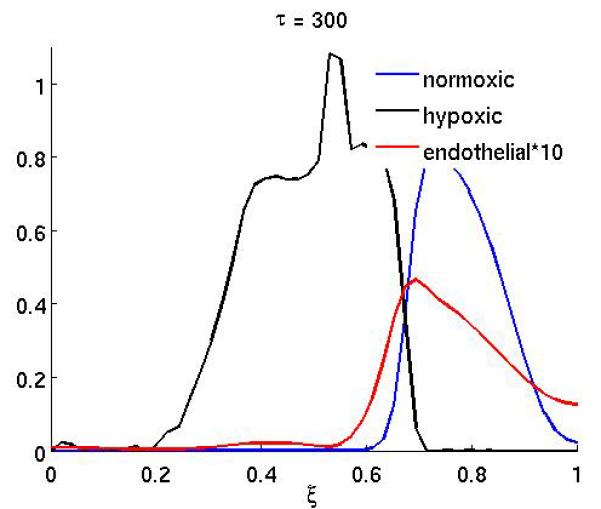
The spatial distribution of normoxic, hypoxic and endothelial cells after chemotherapy has been applied with the drug parameters γn = 1 and γc = 1 at times τ = 250 and τ = 300.


The spatial distribution of normoxic, hypoxic and endothelial cells after chemotherapy has been applied with the drug parameters γn = 1 and γc = 1 at times τ = 250 and τ = 300.