Fig. 3.
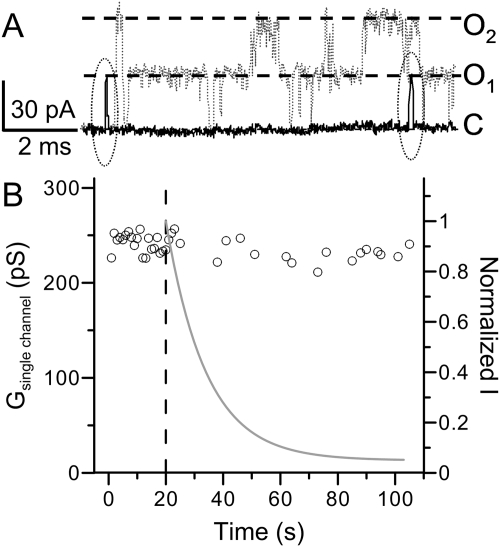
Ag+ modification does not change BK single-channel conductance. A, sample traces of BK single channel activity before (gray, dotted) and during (black, solid) the application of 52 nM Ag+. The patch was held at −70 mV. A 50-ms depolarizing pulse to 140 mV was given each second to activate BK channels. Closed and open levels of BK activity are marked by dashed lines. The two brief openings during Ag+ modification are circled with dotted lines. B, the single-channel conductance of BK channel was plotted against time. Each point is the mean single channel conductance of opening events evoked by a 140-mV test pulse. The single-channel conductance averaged from 20 traces before Ag+ application is 240 ± 2.2 pS, and the single-channel conductance averaged from 19 traces during Ag+ modification is 236 ± 2.2 pS. The gray line shows the time course of macroscopic modification by 52 nM Ag+.

