Fig. 6.
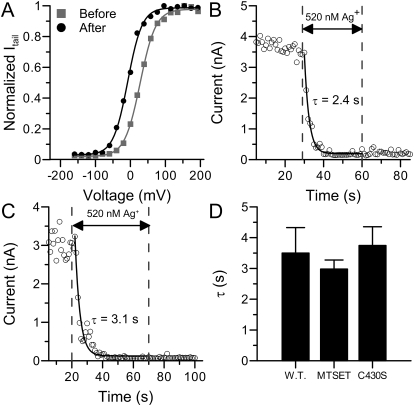
The targets for Ag+ modification are different from those for MTS reagents. A, the G-V profile of macroscopic BK currents in 100 μM [Ca2+]in before (black square) and after (gray circle) perfused in 200 μM MTSET for 3 min. The Boltzmann fitting results were as follows: Vh = 27 mV, z = 1.14 (before); Vh = −8 mV, z = 1.22 (after). B, the time course of modification on BK channels by 520 nM Ag+ after MTSET treatment. Modification started at t = 29 s and ended at t = 60 s. C, The time course of modification on mSlo1C430S by 520 nM Ag+. Modification started at t = 20 s and ended at t = 70 s. D, the histogram of mean modification time constants by 520 nM Ag+ on BK currents (3.5 ± 0.8 s, n = 6), BK currents after MTSET application (2.92 ± 0.3 s, n = 3), and mSlo1C430S currents (3.7 ± 0.6 s, n = 4).

