Fig. 8.
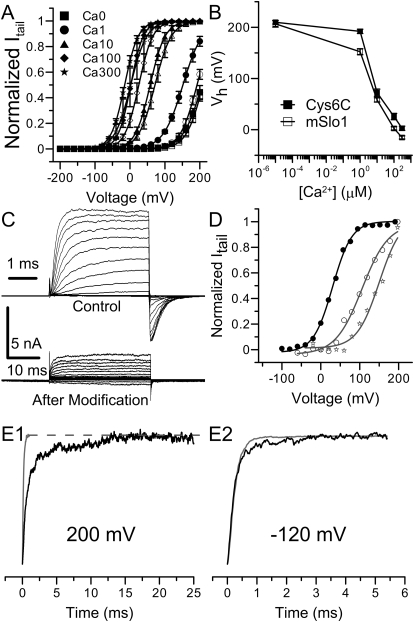
Gating behavior and Ag+ sensitivity of mSlo1Cys6C. A, The G-V curves of mSlo1Cys6C (filled symbols) in a wide range of [Ca2+]in overlap with those of mSlo1 (open symbols) in various [Ca2+]in : 0 μM (■), 1 μM (●), 10 μM (▴), 100 μM (♦), and 300 μM (★). Each set of data is averaged from five patches. Lines are Boltzmann fits. B, the Vh values of mSlo1Cys6C and BK channels are plotted against [Ca2+]in (in log scale). The connecting lines have no physical meaning. C, macroscopic mSlo1Cys6C currents recorded in 100 μM [Ca2+]in before (top) and after (bottom) 240-s perfusion in 520 nM Ag+. The voltage protocol was similar to the one used in Fig. 2A. Notice that the time scales are different in these two sets of recordings. D, the macroscopic G-V profiles of mSlo1Cys6C in 100 μM Ca2+ before Ag+ modification (●), and in 10 μM (☆) and 100 μM [Ca2+]in (○) after Ag+ modification. The Boltzmann fitting results were as follows: Vh = 30 mV, z = 1.02 (100 μM Ca2+ before Ag+ treatment); Vh = 150 mV, z = 0.88 (10 μM Ca2+ after Ag+ treatment); Vh = 106 mV, z = 0.74 (100 μM Ca2+ after Ag+ treatment). E, normalized activation (E1, 200 mV) and deactivation (E2, −120 mV) time course of mSlo1Cys6C currents before (gray) and after (black) Ag+ modification.

