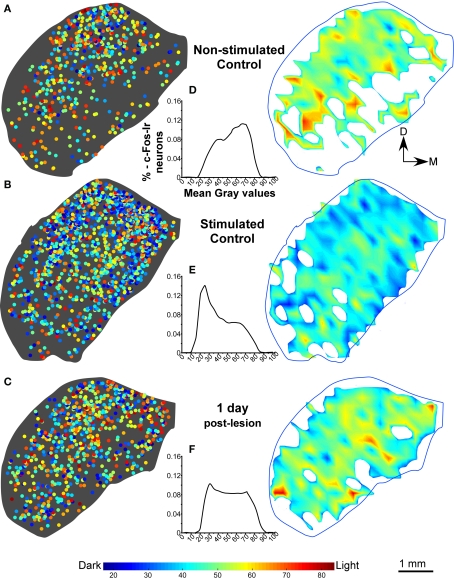
Figure 3.
(A,B) Distribution density, gray value plots, and histograms of c-Fos immunoreactive neuronal nuclei, in representative sections of the inferior colliculus in non-stimulated control groups and control groups after sound stimulation. In stimulated control animals, the sound stimulation protocol utilized (see text), induces a higher density of c-Fos labeling, than in non-stimulated controls (A,B), in particular in the dorsal two-thirds of the nucleus including the dorsal cortex (DCIC). (C) c-Fos labeling density diminishes after stimulation at 1 day post-lesion. As shown in the interval histograms in (D,E), gray intensity values of individual c-Fos immunoreactive nuclei shift toward more intense (higher numerical) values between non-stimulated and stimulated controls. After 1 day post-lesion, values are lower than in stimulated controls and the histogram curve (F) is more flat than in stimulated control group.

