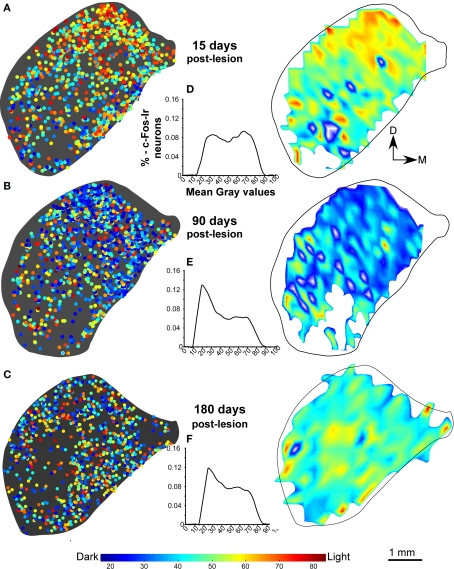
Figure 4.
Distribution density and gray value plots of c-Fos immunoreactive nuclei in representative sections of the inferior colliculus after sound stimulation. (A) After 15 days post-lesion, values continue to be lower than the in the stimulated control group (B,C) c-Fos labeling densities are comparable to those in controls after sound stimulation 90 days (B) and 180 days (C) post-lesion. The interval histograms in (D) shows two slight peaks in values more close to 88, whereas the histograms in (E,F), show that gray intensity values of individual c-Fos immunoreactive nuclei at 90 and 180 days after the cortical lesion are comparable to controls, suggesting recovery of neuronal activity.

