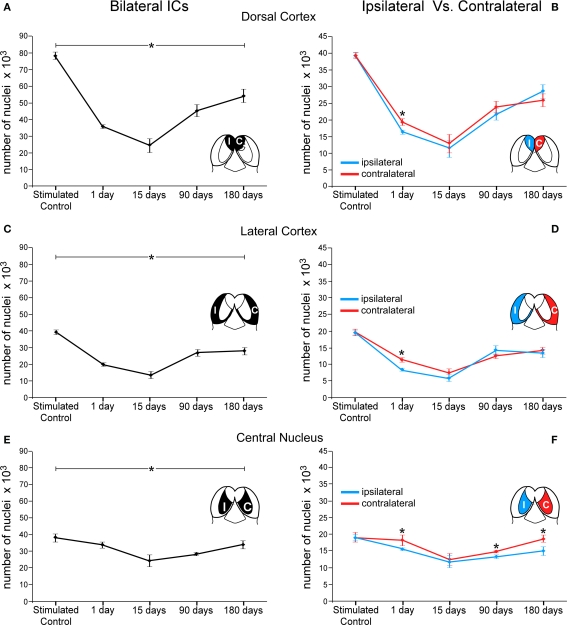
Figure 7.
Graphs showing number of c-Fos immunoreactive neuronal nuclei by cytoarchitectural subdivisions of the IC after sound stimulation at different times after lesions of the auditory cortex. The asterisks denote changes (average ± 2SD, with a p < 0.005) in numbers of immunoreactive nuclei at different times after the cortical lesion. These changes are larger in the dorsal cortex (A) and lateral cortex (C) and less so in the central nucleus (E) although following similar temporal patterns (compare with Figure 6). In (B,D,F) the asterisks show significant differences in c-Fos immunoreactive nuclei between the sides ipsi- and contralateral to the lesion. In animals stimulated 1 day after the cortical lesion, the number of c-Fos immunoreactive nuclei is significantly lower in the ipsilateral side in the three IC subdivisions (*DC: 15%, EC: 27%, and CN: 14%). In the central nucleus (F), the contralateral side shows significantly higher numbers of immunoreactive nuclei after 90 and 180 days of the cortical lesion (*10% and 20%, respectively).

