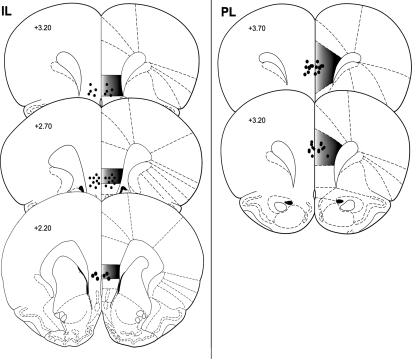
Figure 1.
Site of injections in the IL (Experiments 1, 2, 3, 4, and 6) and PL (Experiment 5). Circles represent injector tip placements that are representative of rats in all experiments. Numbers indicate distance from bregma (millimeters). (Figure adapted from Paxinos and Watson [1998] and reprinted with permission from Elsevier © 1998.)

