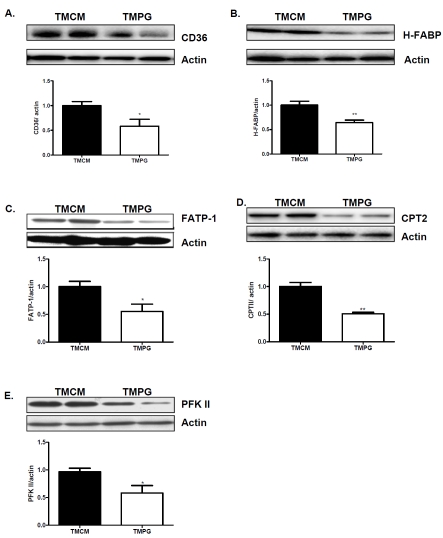
Figure 3.
Protein expression of key proteins in fatty acid and glucose utilization. Western blot analysis of key protein of fatty acid and glucose utilization on total protein samples extracted from left ventricles of 12 week old TMPG and TMCM mice 14 days after the end of tamoxifen treatment. (A) CD36; (B) Heart type FABP; (C) FATP; (D) CPT2 and E) PFK 2. Data are expressed as mean±SEM (n=4, *P<0.05, **p<0.01).

