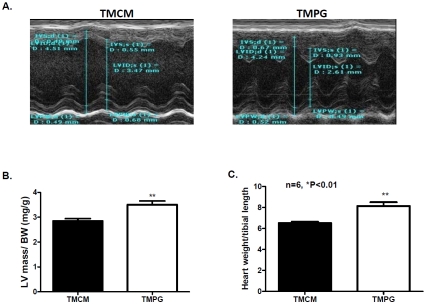
Figure 5.
Measurements of cardiac hypertrophy. (A) Representative M mode images of echocardiography from adult TMPG and TMCM mice. (B) Corrected left ventricular (LV) mass values from echocardiographic measurement normalized to body weight. Data are shown as mean ± SEM. (n=6, **p<0.01). (E) Heart weight to tibial length ratio was measured on the adult TMPG and TMCM mice 3 months after the end of tamoxifen treatment. Data are shown as mean ± SEM. (n=6, **p<0.01).

