
Fig. 3.
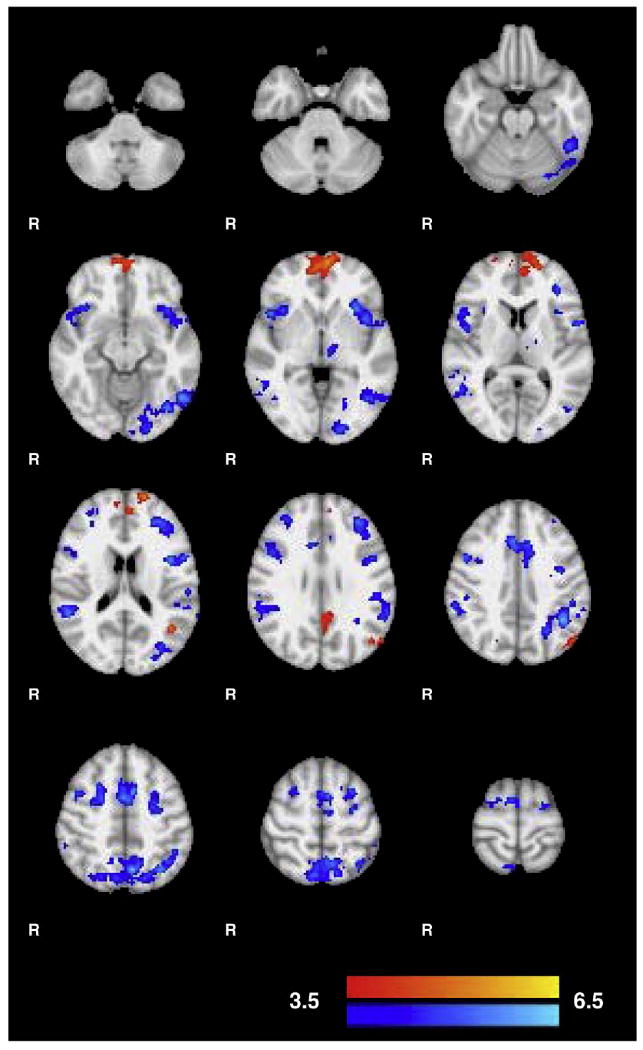
Clusters of increased and decreased activation after training on the mirror-tracking task. Z-stats of increased activity are shown in red and decreased activity in blue. Areas of decreased activity include task specific regions such as the middle frontal gyrus and posterior parietal cortex. Increased functional activity occurred primarily in the medial frontal cortex which has been implicated in response inhibition and the resting state network. Clusters are overlaid on the MNI152. See Table 1 for a list of all clusters.