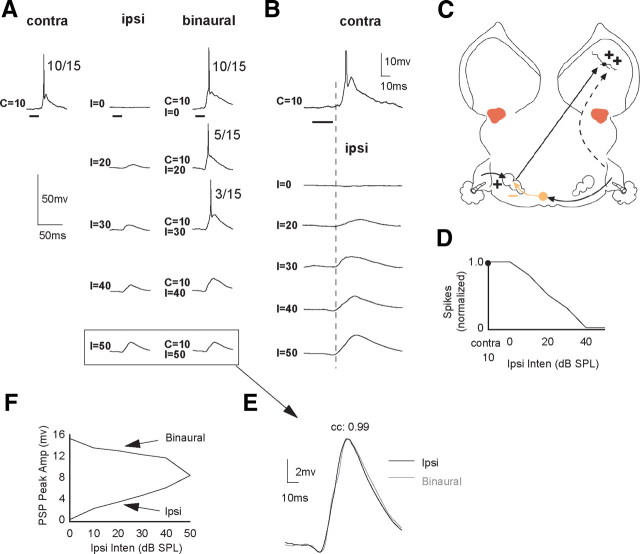
Figure 5.
An EI cell in which ipsilateral tones evoked only EPSPs with amplitudes that increased with intensity. When the same ipsilateral signals were presented binaurally, they strongly suppressed contralaterally evoked spikes. A, Responses evoked by contralateral, ipsilateral, and binaural signals. Bracketed responses show the response to the ipsilateral tone at 50 dB SPL and the response to a binaural tone with the same, 50 dB SPL ipsilateral intensity. B, Same response to contralateral and ipsilateral tones as in A, but contralateral and ipsilateral tones are aligned in time and shown at higher magnification. C, Circuit that could generate the responses. D, IID function in which normalized spike counts are plotted as a function of ipsilateral intensity. Contralateral intensity was 10 dB SPL. E, The responses below the arrow are the two responses in brackets but are superimposed at a higher magnification. Amplitude of EPSPs are ∼8.0 mV. F, Amplitudes of ipsilaterally evoked EPSPs plotted together with the amplitudes of the EPSPs evoked by binaural signals that had the same ipsilateral intensities. Note that ipsilateral EPSP amplitudes increased with sound intensity, whereas the binaurally evoked EPSPs decreased with the same ipsilateral intensities. EPSP amplitudes of binaural signals were measured after spikes were eliminated. Tone duration, 20 ms.

