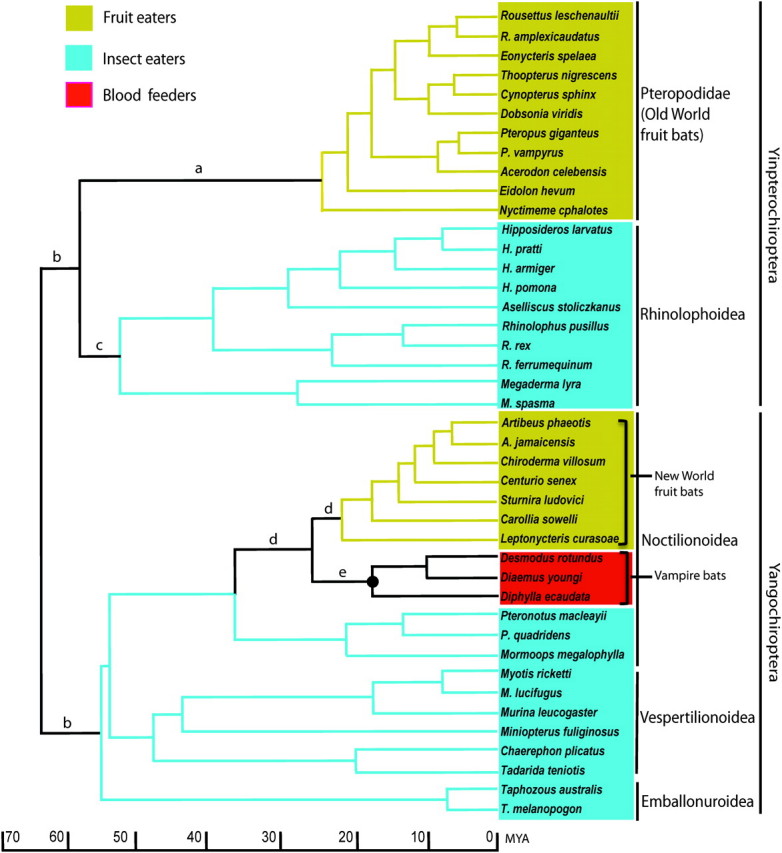
FIG. 1.

The species tree of the 42 bats studied, with the dietary preferences indicated by various colors. The tree topology and approximate divergence times follow Teeling et al. (2005). The common ancestor of vampire bats discussed in the paper is marked with a solid circle. Branch colors indicate sets of branches used in testing the selective pressures on Tas1r2 in Table 1.
