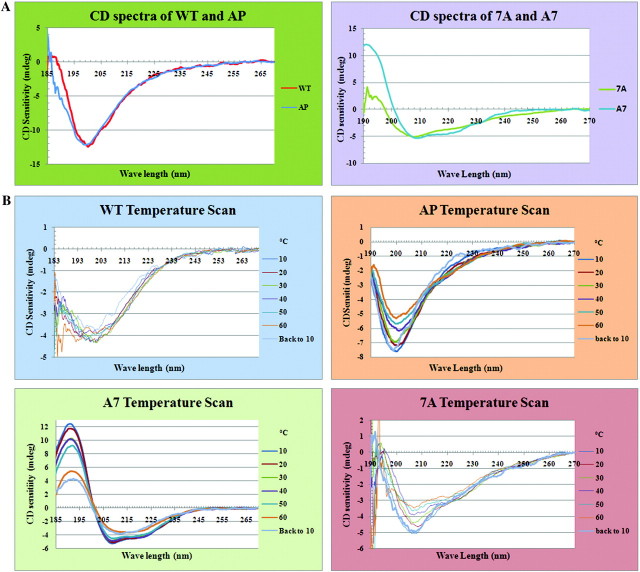
FIG. 2.
CD spectra of WT CTD peptide and CTD mutant peptides under different conditions. (A) CD spectra of WT, AP, 7A, and A7 proteins in pure water. The spectra are the average of eight accumulations for each protein. WT and AP are in the upper group with similar predominant random coil structure, whereas 7A and A7 are in the lower group with a majority of helical structure. The WT and 7A curves were adjusted to the same scale as AP and A7 by magnifying the signal. (B). CD temperature scan spectra for WT, AP, 7A, and A7 proteins. All the four protein samples were measured under different temperatures ranging from 10 °C to 60 °C at 10 °C intervals; “back to 10” indicates that temperature was directly dropped from 60 °C to 10 °C. With increasing temperatures, both WT and AP proteins became more unordered, and when the temperature dropped from 60 °C back to 10 °C, the spectra were not exactly the same as when beginning at 10 °C. These results suggest that changes in conformation from more ordered to less ordered as temperatures increased were not easily reversible and that the WT protein was much harder to bring back to its original conformation than was the AP mutant. As no solid material was observed in the sample cuvette at the end of the temperature scan measurements, the nonreversibility of the protein structures was not due to protein precipitation. In contrast, the 7A protein demonstrated a greater ability to recover its original structure when the temperature returned to 10 °C.

