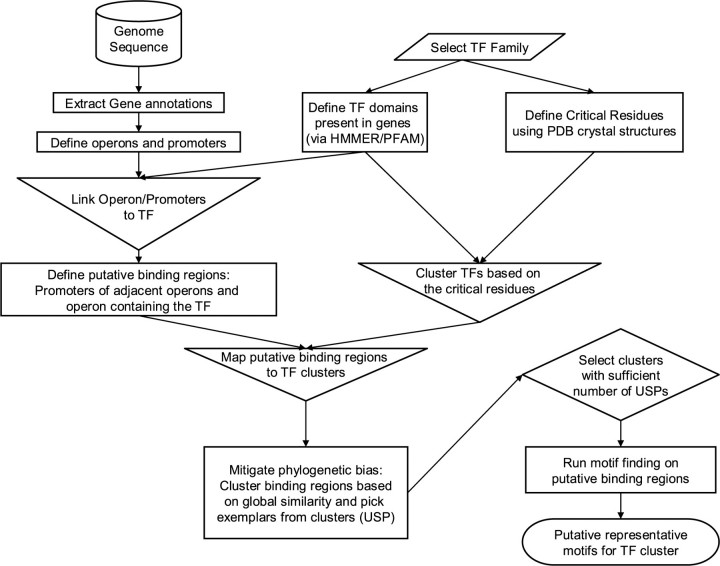
Fig. 1.
Flowchart describing overall method. The shapes are standard flowchart shapes, with the disk showing a database, parallelograms showing user input, the rectangle showing processes, inverted triangles showing merging, diamonds showing selection and the rounded box showing the terminating state.

