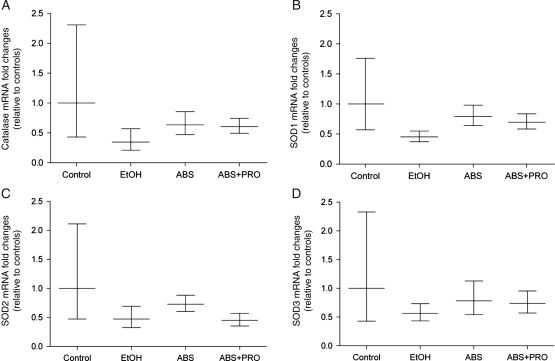
Fig. 4.
Catalase and SOD isozymes gene expressions in rat plantaris. Gene expressions of (A) catalase and (B–D) three SOD isozymes (i.e. Cu/Zn-SOD1, Mn-SOD2 and Cu/Zn-SOD3) were unchanged in any group. Data are represented as means ± range of potential values based on the 2−ΔΔCT method (Otis et al., 2007; Otis et al., 2008) and expressed as fold changes relative to controls (n = 6–7 rats/group). Significance was accepted at P ≤ 0.05.

