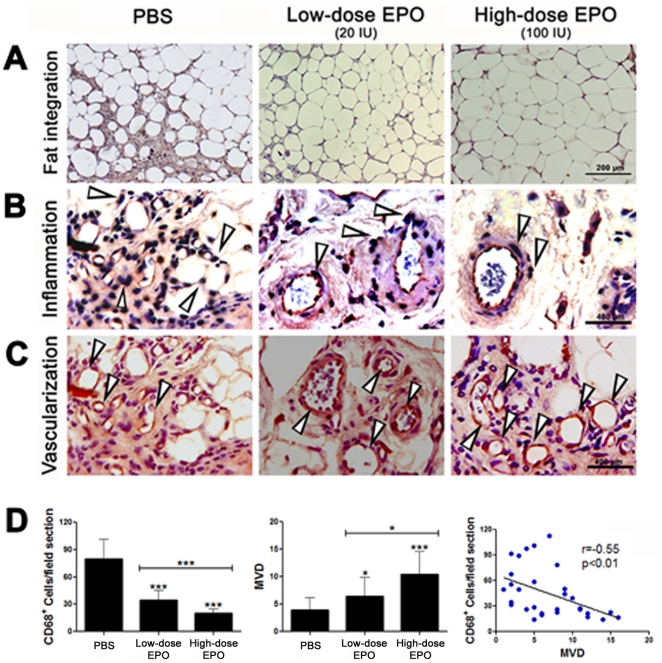
Figure 2. Histological sections of fat grafts that were removed from the PBS-treated, low-dose, and high-dose EPO treated mice 15 week after fat transplantation.
The fat grafts from three different groups of mice were treated with either PBS (100 µl), 20 IU EPO/100 µl PBS (low-dose), or 100 IU EPO/100 µl PBS (high-dose) on the day of the fat injection, and the treatments were repeated every three days for 18 days. After harvesting, sections were stained with hematoxylin and eosin or prepared for assessing inflammatory cell infiltration and MVD, and then examined under a light microscope for (a) the extent of integration, as evidenced by the extent of organization of intact and nucleated fat cells in the grafted fat tissue architecture, (b) the extent of fibrosis, as evidenced by the amount of collagen and elastic fibrils, (c) the presence of cysts and vacuoles, (d) the intensity of the inflammatory response, as evidenced by the extent of macrophage infiltration, and (e) MVD, as evidenced by the number of blood vessels in the fat grafts. Representative histological micrographs of PBS-, and low-dose- and high-dose-EPO treated fat grafts (left to right). (A) fat cell integration in fat grafts, (B) inflammation as evidenced by infiltration of CD68-positive cells (macrophages) in fat grafts, and (C) vascularization in the fat grafts as evidenced by MVD which was quantified by counting CD31-positive vessels. The arrows are pointing to dark-stained CD68-positive macrophages and to red-stained CD31-positive endothelial cells. (D) EPO treatment decreases inflammation (left) and increases MVD (middle) in a dose-dependent manner that correlates negatively (right). Each bar represents the mean CD68-positive cells or MVD ± SD from five regions of interest in each fat graft from each treatment group at the end of the 15-week study period. *P<0.05, ***P<0.001, for the difference between either the low-dose- or the high-dose EPO-treated fat grafts and the PBS-treated grafts. Scale bar for A: 200µm, scale bar for B or C: 400µm.

