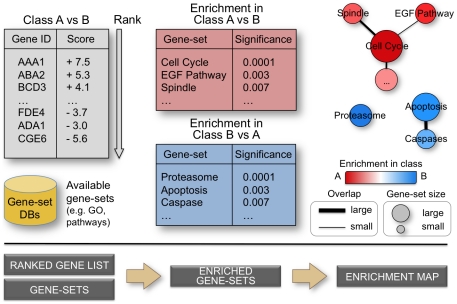
Figure 1. From ranked gene lists to the enrichment map.
High-throughput genomic experiments often output large gene lists, which are typically ranked according to a statistic measuring difference in one experimental condition versus another. Ranked lists are analyzed for enrichment in known sets of functionally related genes (e.g. pathways) from publicly accessible databases. An enrichment map is drawn, representing the enrichment results as a network of gene-sets (nodes) related by their similarity (edges), with enrichment significance encoded by the node color gradient, where color intensity represents significance and color hue (red / blue) represents the class (i.e. biological condition) of interest. Node size represents the gene-set size and edge thickness represents the degree of overlap between two gene-sets.

