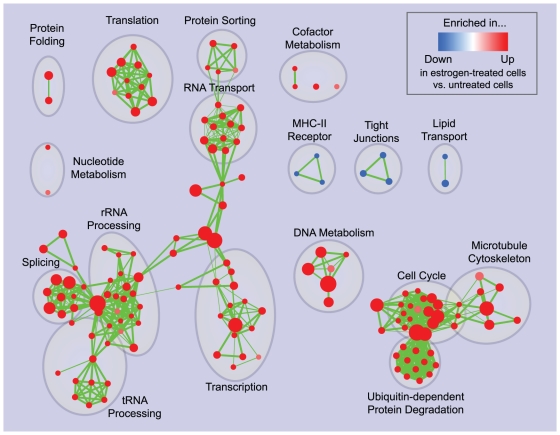
Figure 3. Enrichment map for estrogen treatment of breast cancer cells at 24 hours of culture.
The map displays the enriched gene-sets in estrogen-treated vs. untreated breast cancer cells at 24 hours of culture. As in Figure 2, red node color represents enrichment in estrogen-treated cells (i.e. up-regulation after estrogen treatment), whereas blue represents enrichment in untreated cells (i.e. down-regulation after estrogen treatment); color intensity is proportional to enrichment significance. Clusters of functionally related gene-sets were manually circled and assigned a label.

