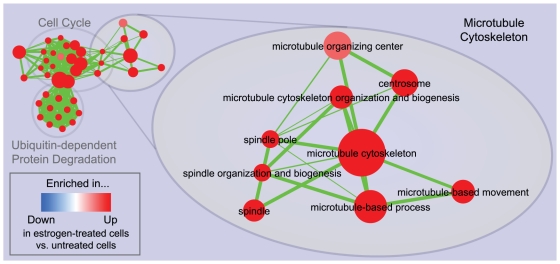
Figure 4. Zoom in of the microtubule cytoskeleton cluster in the 24 hours estrogen treatment enrichment map.
Cytoskeleton-related gene-sets from different GO partitions, such as Spindle (CC) and Microtubule-based process (BP) have been grouped together, unlike in the purely hierarchical visualization in Figure 2. As in the previous figures, red node color represents enrichment in estrogen-treated cells (i.e. up-regulation after estrogen treatment), whereas blue represents enrichment in untreated cells (i.e. down-regulation after estrogen treatment); color intensity is proportional to enrichment significance.

