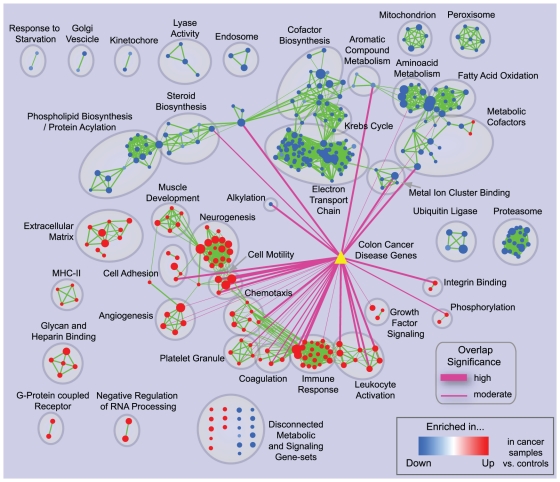
Figure 7. Enrichment map for early-onset colon cancer and overlap with known disease genes.
The map displays the enriched gene-sets in early onset colon cancer patients vs. normal controls. The yellow triangle represents the set of known colon cancer genes from the DiseaseHub database, which integrates disease gene lists from several genotype-phenotype association resources. Purple edges indicate overlap between the disease signature and enriched gene-sets; thickness represents significance. Only edges with a Fisher's Exact Test nominal p-value smaller than 10−4 were visualized.

