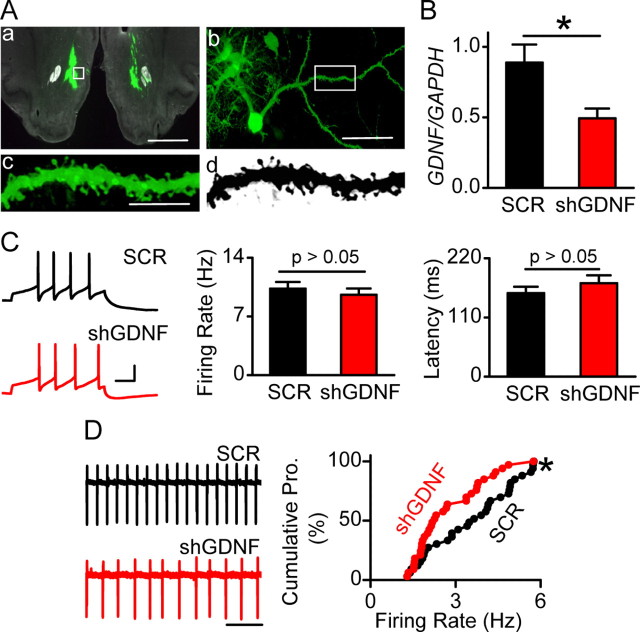
Figure 1.
Viral-mediated downregulation of GDNF mRNA in the NAc does not alter evoked firing but leads to a decrease in spontaneous firing rate of VTA neurons. Recombinant adenovirus containing GDNF shRNA (Adv-shGDNF) or scrambled RNA (Adv-SCR) were bilaterally infused into the NAc of rats. A, Viral infection in the NAc was confirmed by GFP fluorescence 18 d after injection (D18). The white boxes in a and b indicate the position of the MSN shown in b and the position of the spiny dendrite shown in c and d (c and d are the same dendrite in color and black and white, respectively). Scale bars: a, 2 mm; b, 50 μm; c, 10 μm. B, Adv-shGDNF decreases GDNF expression in the NAc. The NAc tissue from Adv-shGDNF- and Adv-SCR-infected rats was dissected at D18 for quantitative reverse transcription-PCR analysis of mRNA levels of GDNF. The bar graph depicts the average GDNF/GAPDH ratio. *p < 0.05. n = 5 rats for each group. C, Downregulation of GDNF in the NAc does not alter the frequency of VTA neuronal firing evoked by somatic current injections. Cell membrane potentials were brought to −60 mV in whole-cell current-clamp mode, and a depolarization step of 120 pA (0.5 s) was injected to induce evoked firing. Left, Sample voltage trace response to the current injection in slices from Adv-SCR (SCR; top)- and Adv-shGDNF (shGDNF; bottom)-treated rats. Calibration: 30 mV, 100 ms. Middle and right, Bar graphs depicting no difference in firing rate (middle) and latency (right) of evoked VTA neuronal firing between Adv-SCR- and Adv-shGDNF-treated rats. The frequency was measured between the first two spikes. n = 35 (SCR) and n = 34 (shGDNF) neurons from 13 rats for each group. The latency was defined as the duration between the onset of current injection to the peak of the first spike. n = 36 (SCR) and n = 35 (shGDNF) neurons from 13 rats for each group. D, Downregulation of GDNF in the NAc decreases the spontaneous firing rate of VTA neurons. Left, Representative traces of spontaneous firing of VTA neurons in Adv-SCR (SCR; top)- and Adv-shGDNF (shGDNF; bottom)-infected rats. Note that the interspike interval is larger (thus the frequency is lower) in the bottom trace than in the top trace. Right, Cumulative probability (Cumulative Pro.) plot comparing individual neurons in slices from Adv-shGDNF- and Adv-SCR-treated rats. *p < 0.05, Kolmogorov–Smirnov test. n = 33 neurons from 9 rats for each group. See also supplemental Figure S1, available at www.jneurosci.org as supplemental material.

