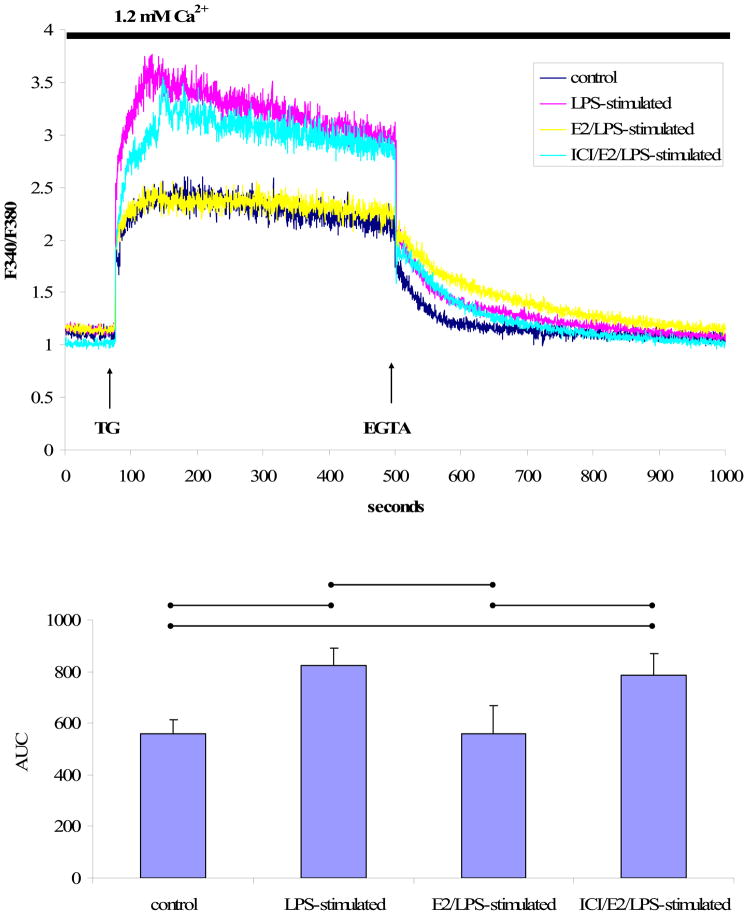
Fig. 3. TG-induced Ca2+ signals in the presence of extracellular Ca2+.
A) A representative tracing of the Ca2+ signal from EA.hy926 cells in response to TG (1 μM) in the presence of 1.2 mM extracellular Ca2+ followed by EGTA (2 mM) treatment. B) The mean ± standard deviation of the Ca2+ AUC traced during the response to TG in the presence of extracellular Ca2+. Significant differences among individual treatment groups are indicated (•—•, P<0.05, n=5) as analyzed using a one-way ANOVA, followed by a Bonferroni post hoc test.

