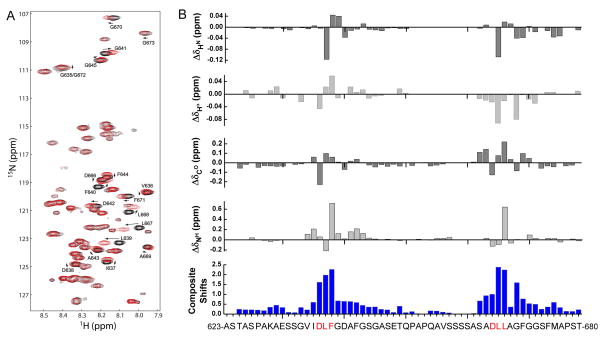
Figure 3.
AP180 M5 undergoes chemical shift perturbations in the presence of clathrin TD. A. An HSQC spectrum of 500 μM 15N-13C labeled AP180 M5 is shown in black while a spectrum of 500 μM 15N-13C labeled AP180 M5 with 500 μM unlabeled clathrin TD is shown in red. B. Chemical shift differences between AP180 M5 in the free and TD bound states. The composite absolute shift perturbations shown in blue include the backbone HN, Hα, CO and NH shift perturbations. The regions showing significant chemical shift changes are consistent with the putative clathrin binding sites identified by our previous studies34.

