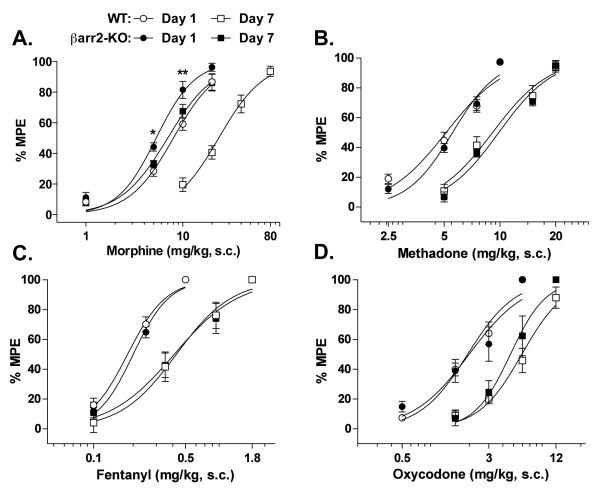
Figure 2.
Cumulative-dose response curves in WT and βarr2-KO mice in response to chronic (A) morphine (48 mg/kg/day, s.c.; two-way ANOVA analysis for genotype effect compared at day 1: P<0.0001, WT vs KO: *P<0.05, **P<0.01, Bonferroni post-hoc analysis, n=8-11 WT, 8-12 KO), (B) methadone (96 mg/kg/day, s.c., n=6 WT, 6 KO), (C) fentanyl (3.2 mg/kg/day, s.c., n=5 WT, 5 KO), or (D) oxycodone (25 mg/kg/day, s.c., n=5 WT, 5 KO) infusion over a 7 day period. Dose-response curves were determined using a cumulative dosing scheme on day 1 before osmotic pump implantation, and then again after 7 days of chronic drug infusion. Data are presented as the mean ± S.E.M. For B-D, two-way ANOVA analysis revealed no difference for genotype effect (P>0.05).

