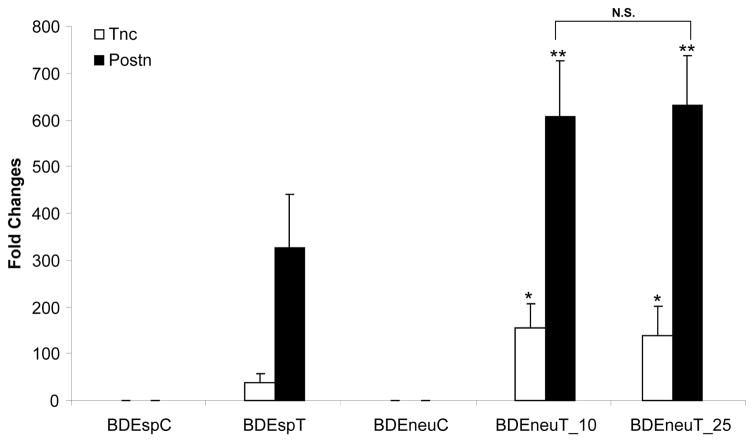
Figure 4.
Bar chart representation of genes (Postn and Tnc) belonging to the extracellular matrix gene ontology classification whose expression is differentially altered in BDEneu liver tumors compared with BDEsp liver tumors. Fold changes for each BDE tumor type (BDEspT, BDEneuT at 10 days and at 25 days) are calculated against their respective parent BDE cell line (BDEspC and BDEneuC). Asterisks: unpaired two-tailed t-test BDEneu tumors versus BDEsp tumors, * p-value < 0.05; ** p-value < 0.005. Error bars represent SD. N.S.=not significant.

