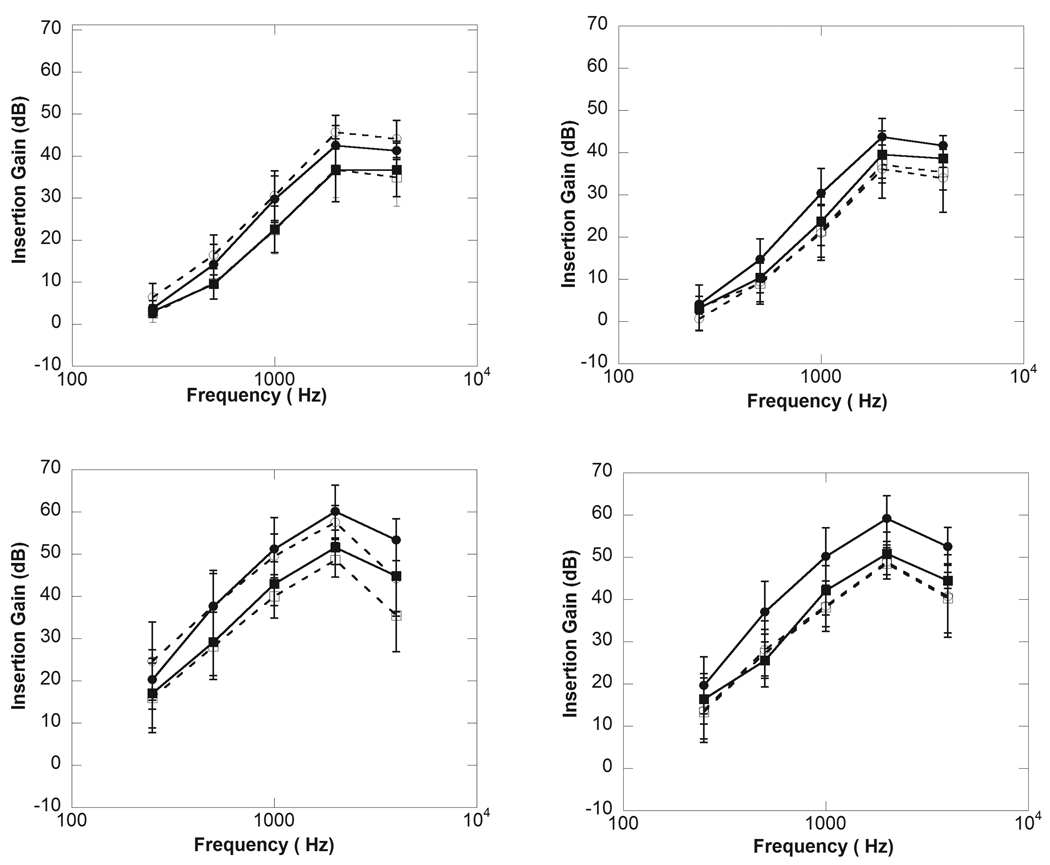
Figure 2.
Mean for match to prescribed target gain for listeners with mild-to-moderate hearing loss for fast-acting WDRC (top left panel) and CL amplification (top right panel) amplification. The bottom left and right panels illustrate mean match to target gain for listeners with severe hearing loss for fast-acting WDRC (bottom left) and CL (bottom right) amplification. The filled circles bars represent prescribed target gain at 50 dB SPL; the open circles represent real-ear insertion gain (REIR) at 50 dB SPL. The filled squares represent prescribed target gain at 65 dB SPL; the open squares represent real-ear insertion gain (REIR) at 65 dB SPL. The error bars represent ±1 standard deviation about the mean.

