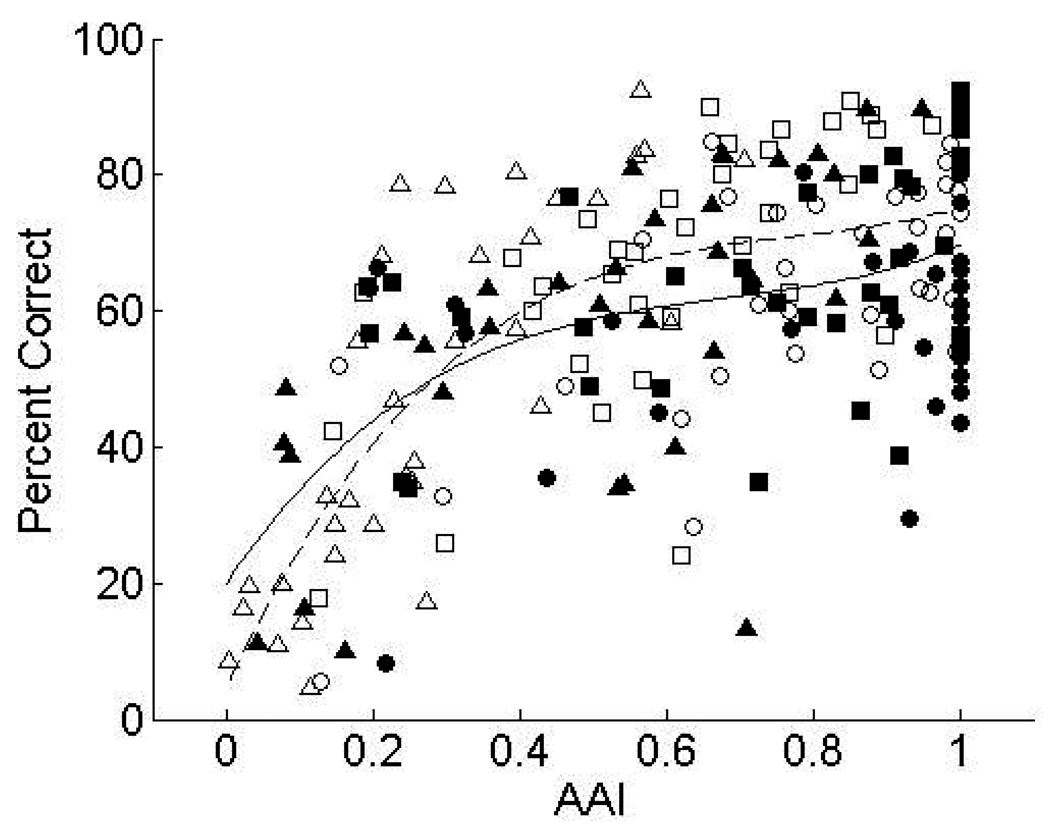
Figure 5.
Scatter plot representing Aided Audibility Index values (x-axis) versus percent correct score (y-axis). The filled symbols represent fast-acting WDRC amplification and the unfilled symbols represent CL amplification. The triangles represent 50dB SPL; the squares represent 65dB SPL; and the circles represent 80 dB SPL. The regression lines represent the relationship between percent correct score and AAI for CL (dotted) and fast-acting WDRC (solid) amplification.

