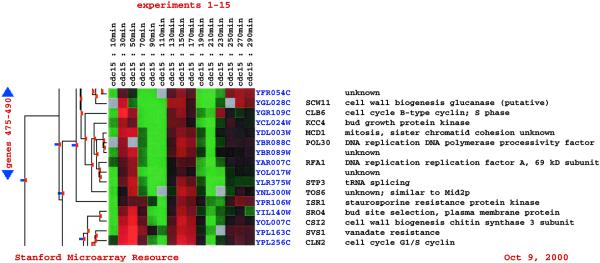
Figure 2.
Hierarchical cluster. A portion of a hierarchical cluster, which can be easily navigated, is shown. Red indicates up-regulation in the experimental sample, and green indicates down-regulation in the experimental sample, with respect to the control. The intensity of the color indicates the magnitude of up- or down-regulation (see 6).

