
Figure 1.
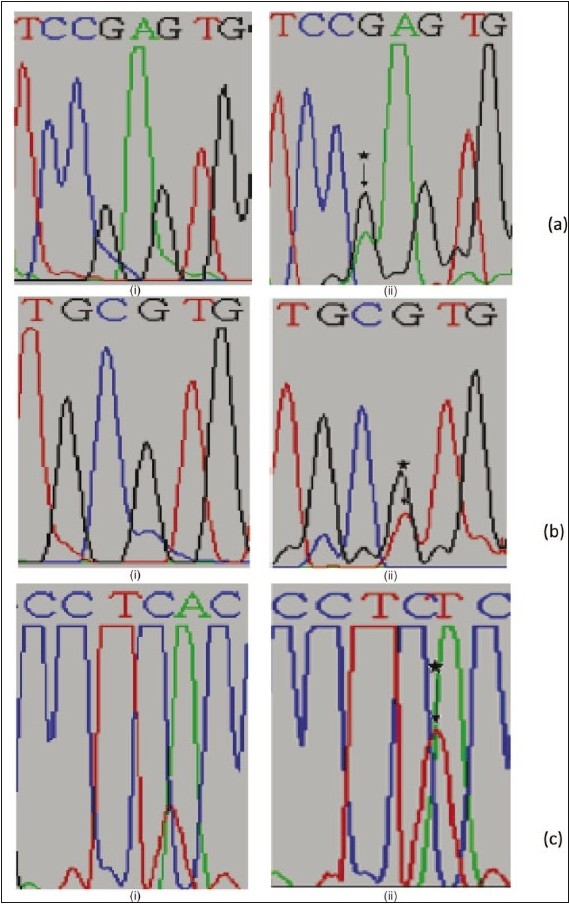
Partial electropherograms representing the normal (i) and mutant (ii) profiles in I and II of exon 6 and III of exon 8 of TP53. (a) Shows the transition of G to A. (b) Shows the transversion of G to T. (c) Shows the insertion of T leading to frameshift mutation