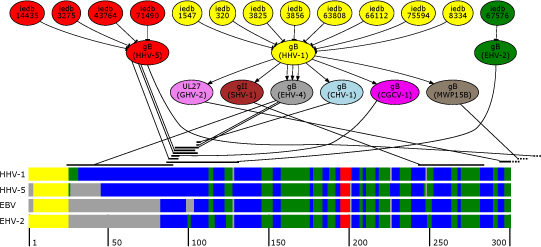
Figure 4.

Presented is an overview of the epitope mapping process. The upper part depicts a subgraph comprising shortest paths between known epitopes and EBV gp110. The lower part of the figure shows the first 300 positions of a multiple secondary structure alignment of homologous envelope glycoproteins of EBV, HHV-5, HHV-1 and EHV-2. To improve readability secondary structures are color coded (helical areas in red, beta sheets in green, coils in blue, signal peptides in yellow and gaps in grey). The black strands above the multiple alignment mark possible mapping positions with respect to their position on the gp110 protein of EBV which are connected to their predecessor in the shortest path.
