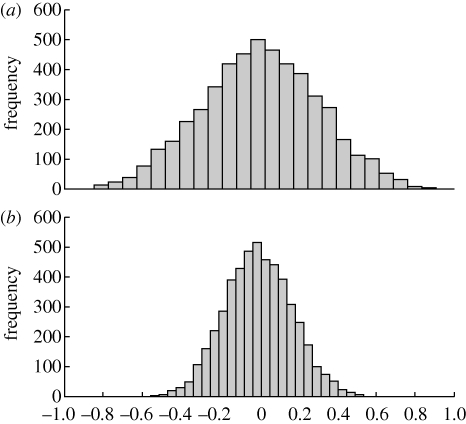
Figure 3.
Causes of higher type I error rates. Distribution of correlation coefficients statistics for (a) paired and (b) unpaired transmission of continuously varying traits across 5000 simulations. Paired transmission of traits during horizontal transmission events does not result in biased parameter estimates (mean value for paired transmission = 0.0064, versus −0.002 for unpaired transmission). Instead, the elevated type I error rates for paired compared with unpaired trait transmission result from a wider expected distribution of statistics (s.d. of 0.2996 and 0.1724 for paired and unpaired transmission, respectively). Results are from a 6 × 6 matrix with probability of extinction of 0.08, horizontal donation of 0.01, no correlation among the traits, variance of trait change of 0.02 and 60 generations.

