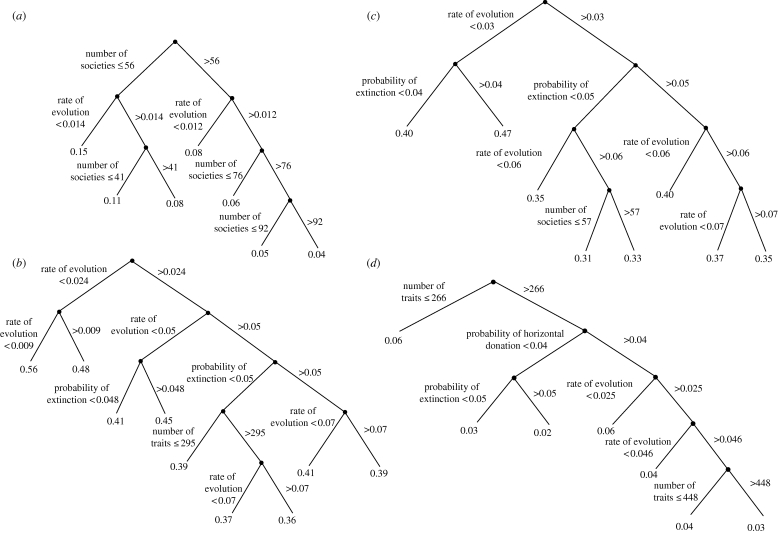
Figure 4.
Regression tree analyses. Regression trees for the (a) CI and (b) RI using phylogenies from the parsimony analyses of the simulated cultural trait data; (c) RI using phylogenies from the ‘true tree’ saved in the simulation program; and (d) the difference in the RI between the parsimony and ‘true’ trees.

