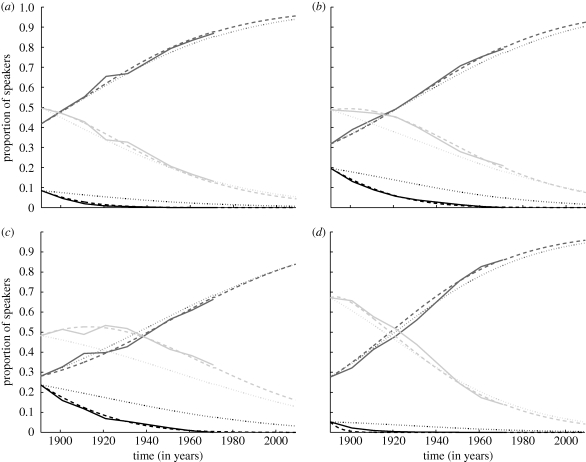
Figure 2.
Frequencies of the three sub-populations in the four Scottish Highland counties for the time period 1891–2010. Empirical data (solid lines) and predictions of model (5.1) under the assumptions c31 = c32 and c13 = c12 (dotted lines) and c31 ≠ c32 and c13 ≠ c12 (dashed lines) of the frequencies of Gaelic (black), bilingual (light grey) and English (grey) speakers in (a) Argyll, (b) Inverness, (c) Ross and Cromarty and (d) Sutherland over time.

