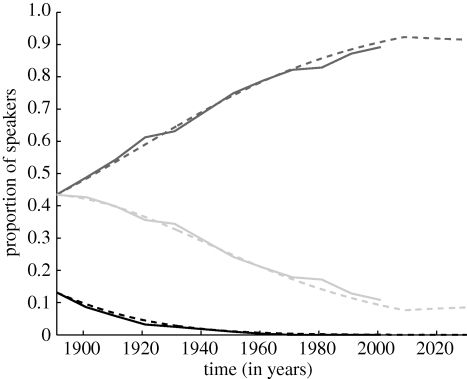
Figure 4.
Empirical and projected frequencies of the three sub-populations in the Scottish Highlands for the time period 1901–2030 with assumed intervention after 2009. Empirical data (solid lines) and predictions of model (5.1) until 2009 and model (5.2) after 2009 (dashed lines) of the frequencies of Gaelic (black), bilingual (light grey) and English (grey) speakers. Parameter values for model (5.1) are given in table 1 (bottom rows); after 2009, a diglossic model with the same c-values and w1 = 0.0035 and w3 = 0 is assumed.

